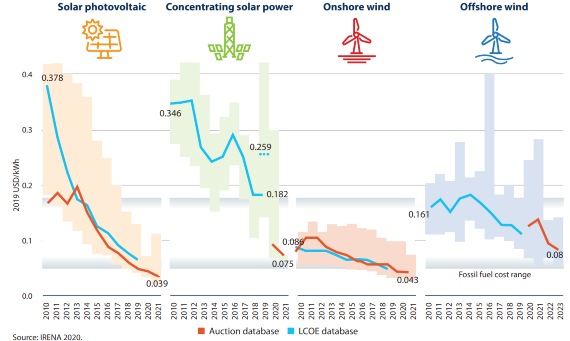
Evolution ofthe prices of electricityproduced by the main renewable technologies. The trends observed since 2010 are presented. The different ranges shown for each technology correspond to the price variations based on country. The solid lines are the average values and the horizontal line that goes across the entire graph (at the bottom), the margins of variation in the prices of the electricity obtained with fossil fuels.